
I have some data.... world population data, I cleaned it and created few charts or graphs to provide visuals of the data.
-------
The population data by country, year, and gender wise.

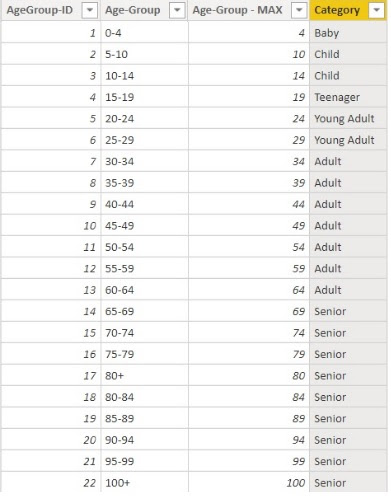
Age group and Category
Country and Region

------------------
I have made few simple charts and graphs..
Population by year (1950-2100) and age Category wise.
Population by year (1950-2100) and age Category wise.

Population by year (1950-2100) and Region wise.


Genyoutube
ReplyDeleteSave From Net
Blogtipshub is the best source to get latest blog tips on how to blog, SEO, Marketing and so on.
ReplyDelete